February 25th, 2026
New
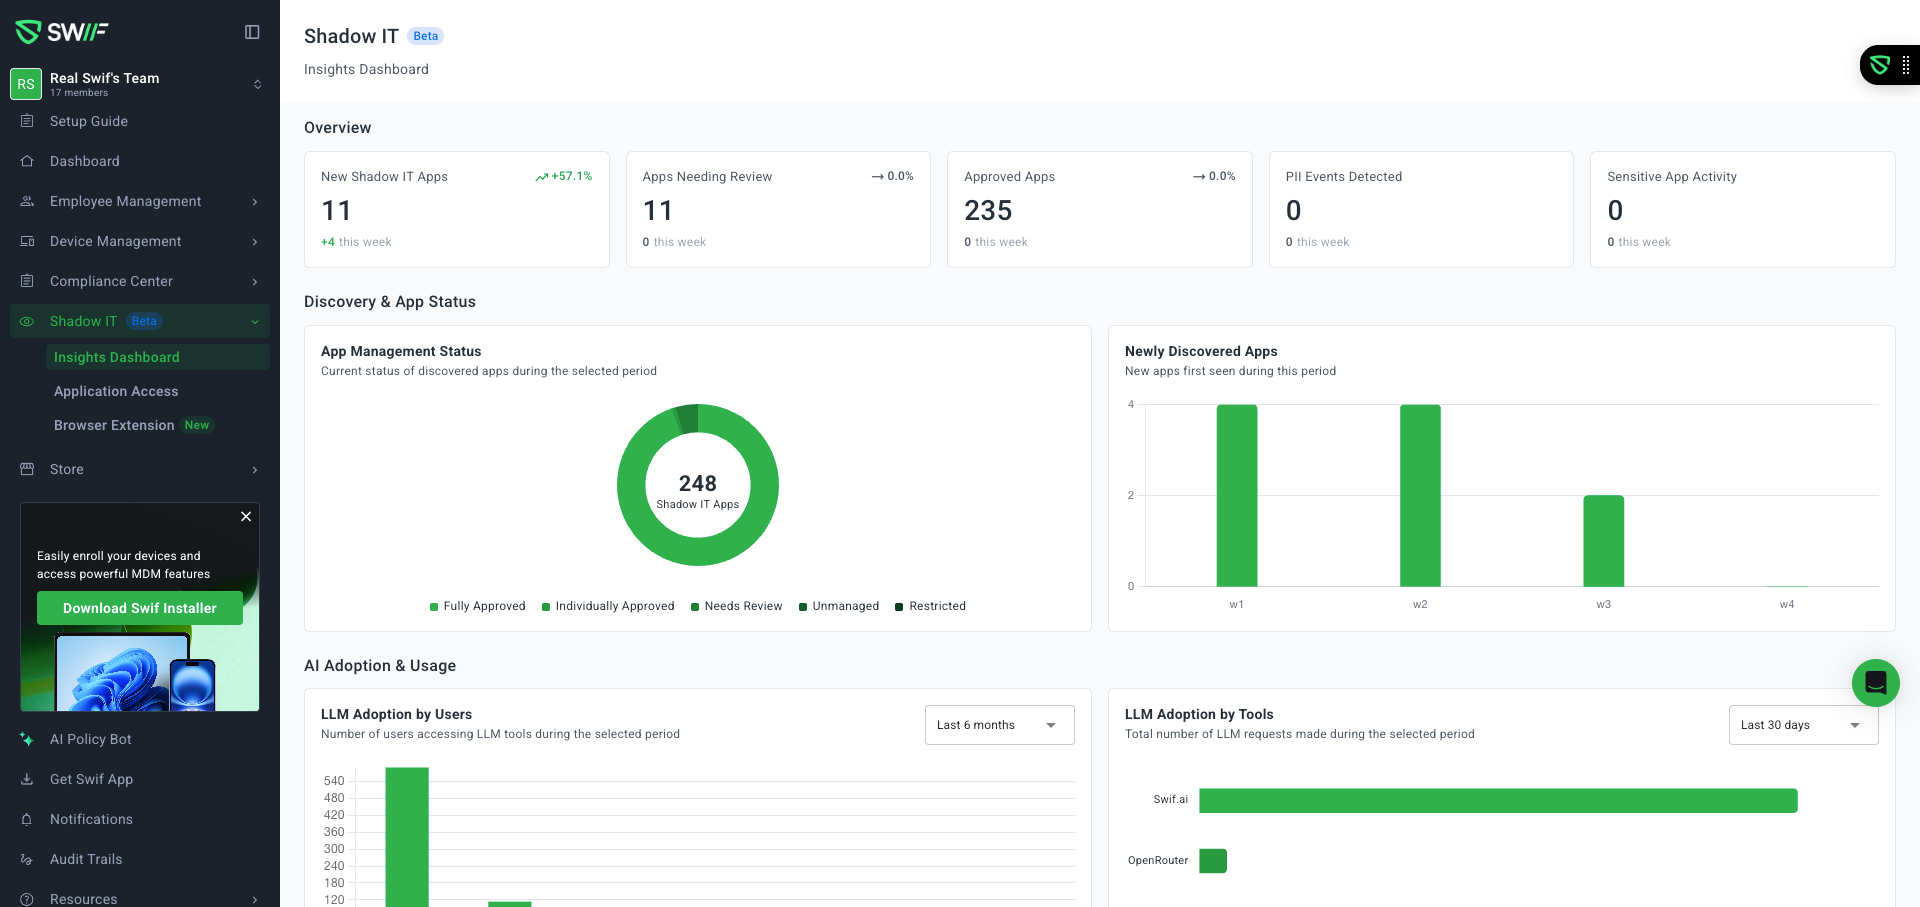
Shadow IT – Insights Dashboard & LLM usage widgets
We’ve redesigned the Shadow IT Insights Dashboard to make AI and Shadow IT activity clearer and easier to understand.
What’s new
Updated Overview KPIs
KPI row now fills the full width with no awkward gaps.
Each KPI shows a trend percentage (e.g.
+12%,-3%) instead of icons.KPI widgets align with the new 1.0.1 design from our updated design system.
Discovery & App Status
Discovery & App Status now uses a donut chart built on our new Shadcn-based charting system.
Newly Discovered Apps is now a bar chart that aligns with the global time range filter and dashboard styling.
AI Adoption & Usage (LLM usage)
New stacked bar chart for LLM Adoption by Users, breaking down usage across different LLM providers.
New widget: “LLM Adoption by Tools”
Mixed bar chart showing total LLM requests by tool/provider for the selected time range.
On hover, tooltips include the top 3 users by request volume for each tool (currently wired for live or placeholder data depending on backend readiness).
Risk & Exceptions
New card list for:
Individually Approved Apps with Unauthorized Activity
(PII-related cards are scaffolded but will ship later with the broader PII feature set.)
Card lists support loading, empty, and error states consistent with the rest of the dashboard.
Under the hood
All new charts and cards leverage our Shadcn-based design system for consistent layout, typography, colors, and components.
Widgets respect the global time range filter so you can analyze trends for any selected window.